Understanding Genetic Relationships
This guide explains the genetic concepts behind lineage and how to interpret your results.
Note
A note on genetic discoveries: DNA analysis can sometimes reveal unexpected relationships or information that wasn’t previously known. Approach discoveries with care and respect for everyone involved.
How DNA is Inherited
Humans have 23 pairs of chromosomes. For each pair, you inherit one chromosome from your mother and one from your father. This means:
You share exactly 50% of your DNA with each parent — one complete chromosome from each pair
Siblings share variable amounts of DNA — on average ~50%, but it varies due to the randomness of inheritance
Identity By Descent (IBD)
When lineage analyzes shared DNA, it uses Identity By Descent (IBD) to classify sharing
patterns at each genomic segment:
IBD0: No chromosomes shared — the individuals inherited different chromosomes from both parents
IBD1: One chromosome shared (half-identical region) — the individuals share DNA on one chromosome of a pair (shown in light blue in plots)
IBD2: Both chromosomes shared (fully identical region) — the individuals share DNA on both chromosomes of a pair (shown in dark purple in plots)
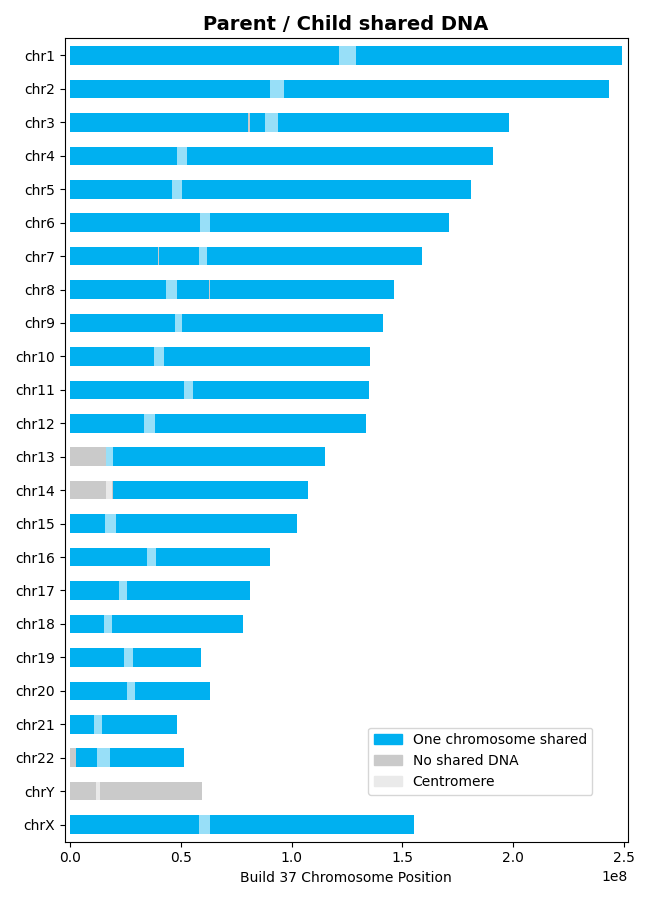
Parent-Child Relationships
A child inherits exactly one chromosome from each parent at every position. This means:
All positions between parent and child are IBD1 (one chromosome shared)
There is no IBD2 sharing (a child cannot inherit both chromosomes from one parent)
The total shared DNA is approximately 3400–3700 centiMorgans
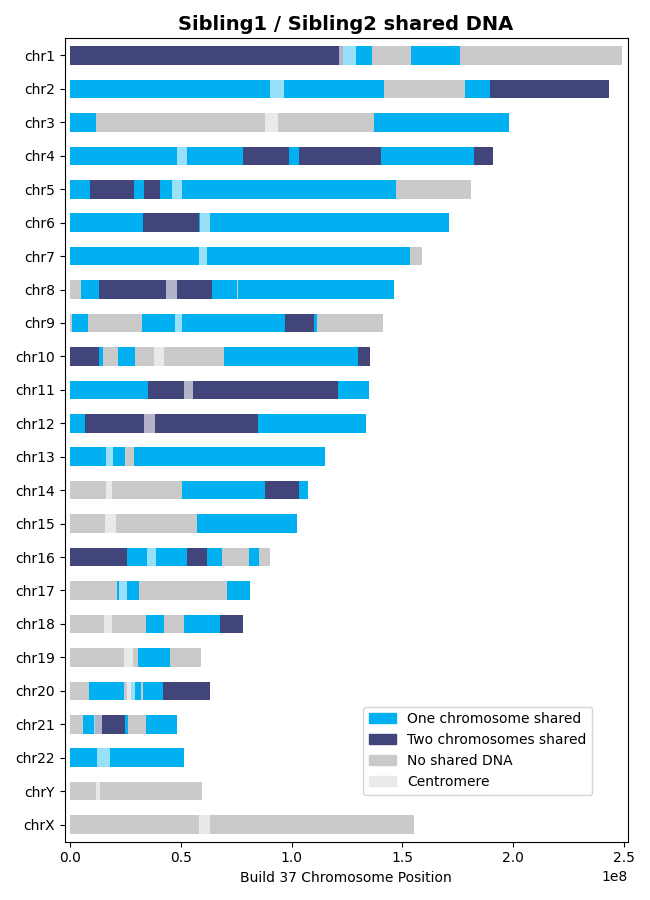
Sibling Relationships
Siblings inherit chromosomes from the same two parents, but which specific segments they inherit is random due to a process called meiotic recombination. During the formation of egg and sperm cells, chromosomes exchange segments, creating unique combinations.
For full siblings, at any given position in the genome:
~25% chance: IBD0 (no sharing) — each sibling inherited different chromosomes from both parents
~50% chance: IBD1 (one chromosome shared) — siblings inherited the same chromosome from one parent
~25% chance: IBD2 (both chromosomes shared) — siblings inherited the same chromosomes from both parents
At any genomic position, these states are mutually exclusive: IBD1 means exactly one chromosome copy is shared, while IBD2 means both copies are shared. Total shared DNA equals IBD1 + IBD2.
What are CentiMorgans?
A centiMorgan (cM) is a unit that measures genetic distance based on recombination frequency, not physical distance. One centiMorgan corresponds to a 1% chance that a segment will be separated by recombination in a single generation.
Why use centiMorgans instead of base pairs?
Recombination rates vary across the genome — some regions recombine frequently, others rarely
CentiMorgans account for these differences, giving a more accurate measure of genetic relatedness
The total human genome is approximately 3400–3700 cM (depending on the genetic map used)
Typical shared DNA amounts:
Relationship |
Shared DNA (cM) |
IBD1 (cM) |
IBD2 (cM) |
|---|---|---|---|
Parent/Child |
~3400–3700 |
~3400–3700 |
0 |
Full Siblings |
~2300–2900 |
~1700–2000 |
~600–900 |
Half Siblings |
~1300–2300 |
~1300–2300 |
0 |
First Cousins |
~550–1200 |
~550–1200 |
0 |
Note
Total shared DNA = IBD1 + IBD2. Only relationships through both parents (full siblings, double first cousins, etc.) can have IBD2 sharing, since IBD2 requires inheriting the same DNA from both the mother and father.
Genetic Maps
A genetic map provides recombination rates across the genome, allowing lineage to
convert physical distances (base pairs) into genetic distances (centiMorgans).
lineage supports two sources of genetic maps:
HapMap Phase II
The International HapMap Project
mapped genetic variation across human populations. This is the default genetic map in lineage.
Covers all autosomes (chromosomes 1–22) and the X chromosome
Good general-purpose choice for most analyses
1000 Genomes Project
The 1000 Genomes Project provides population-specific genetic maps with more detailed recombination data.
Available populations include:
CEU: Utah residents with Northern/Western European ancestry
YRI: Yoruba in Ibadan, Nigeria
CHB: Han Chinese in Beijing, China
And many others
Note
The 1000 Genomes maps do not include the X chromosome, so shared DNA on chromosome X will not be computed when using these maps.
Using a population-specific map can provide more accurate centiMorgan calculations if you know the ancestral background of the individuals being compared:
>>> results = l.find_shared_dna([ind1, ind2], genetic_map="CEU")
Understanding Thresholds
lineage uses two thresholds to filter out noise and reduce false positives when detecting
shared DNA segments:
cM_threshold (default: 0.75 cM): Minimum genetic length of a shared segment
snp_threshold (default: 1100 SNPs): Minimum number of SNPs in a shared segment
These conservative defaults help ensure that detected segments represent true shared DNA rather than matching by chance. You can adjust these thresholds:
>>> # More permissive — reveals smaller segments but may include false positives
>>> results = l.find_shared_dna([ind1, ind2], cM_threshold=0.5, snp_threshold=500)

>>> # More conservative — only shows larger, high-confidence segments
>>> results = l.find_shared_dna([ind1, ind2], cM_threshold=1.0, snp_threshold=1500)
Discordant SNPs
Discordant SNPs are genetic variations that don’t follow expected inheritance patterns (Mendelian inheritance). Finding discordant SNPs between a parent and child can indicate:
Genotyping errors in the raw data
Mutations that occurred during DNA replication
Data quality issues from the testing company
A small number of discordant SNPs is normal. A large number may indicate data quality problems or that the individuals may not have the expected biological relationship.
>>> discordant = l.find_discordant_snps(parent, child)
>>> len(discordant)
42  # A small number is typical
Interpreting Results
The find_shared_dna method returns a dictionary with these keys:
Key |
Description |
|---|---|
|
IBD1 segments (DNA shared on one chromosome) |
|
IBD2 segments (DNA shared on both chromosomes) |
|
Genes in IBD1 segments (if requested) |
|
Genes in IBD2 segments (if requested) |
|
SNPs with unexpected patterns in IBD1 regions |
|
SNPs with unexpected patterns in IBD2 regions |
Tips for Analysis
Start with defaults — The default thresholds work well for most analyses
Compare total centiMorgans — Sum the
cMscolumn to get total shared DNA and compare with expected values for the suspected relationshipLook at the plot first — The visualization quickly shows the pattern of sharing across all chromosomes
Consider the relationship type:
Parent-child: Expect IBD1 sharing across the entire genome
Full siblings: Expect a mix of IBD1 and IBD2 sharing
Half siblings: Expect IBD1 sharing only (no IBD2), with gaps showing IBD0 regions
More distant relatives: Expect smaller, scattered IBD1 segments
Check for data quality — Large gaps in the plot may indicate regions where SNPs weren’t tested rather than regions of no sharing